Range bar charts are a popular alternative to the time based charts that most are trading. As swing traders we look at monthly, weekly, daily, or four hour candlestick charts to identify trading opportunities.
As many traders know, the more variables you place onto your trading strategy, confusion sets in and many get caught in analysis as opposed to actual trading.
Range bar charts provide an alternative that is independent of time and provides greater insight into the market price action.
Range bar charts have the following characteristics that you should be aware of before you even try to trade with them
The following is a chart showing ten pip range bars for the USDCAD. Notice how uncluttered this chart is and how little noise there is in the bars – price chop and spikes are essentially eliminated.
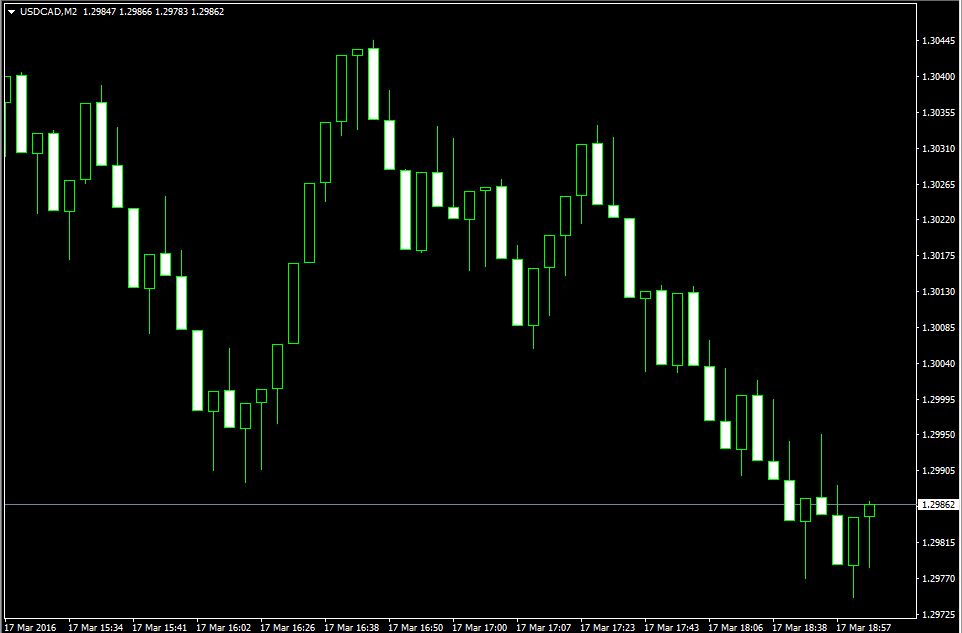
10 PIP RANGE BAR CHART IN FOREX
Trends, reversals and pullbacks become much clearer on range bar charts than they are on time based chart. The less data you have to process usually results in a better outcome.
The range bars also allow us to identify formations and price patterns easily and to spot entries earlier – we don’t need to wait for a four hour bar to close to know that price has formed a double top or bottom or that price has retraced and is now resuming the original trend. Look at the following fifty pip range bar chart.
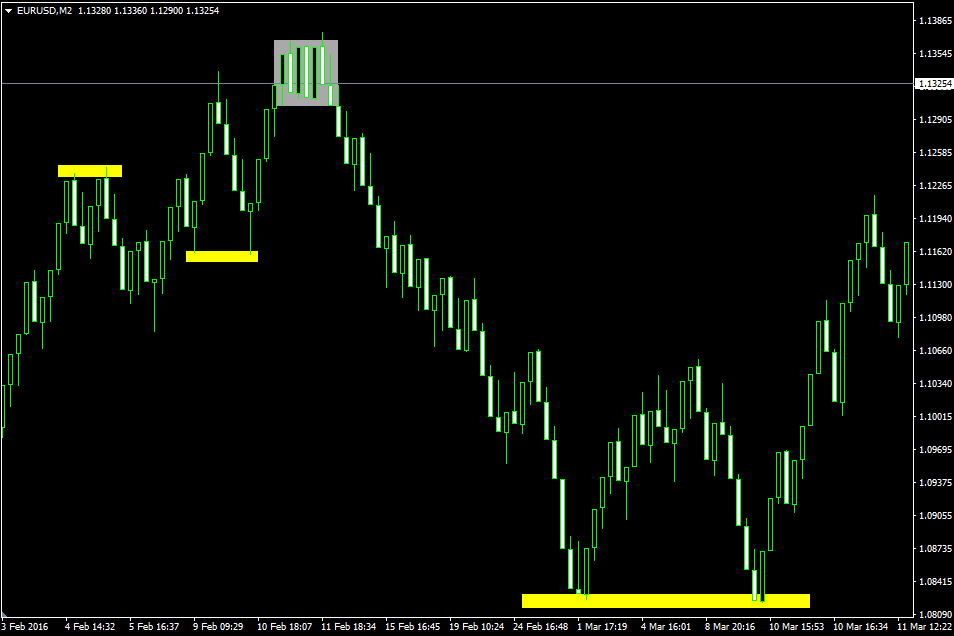
DOUBLE BOTTOM RANGE BARS
The double top and bottoms are clearly visible and a simple strategy of entering on the first close bouncing off the formation and exiting on the first reversal bar would have netted you 32, 108 and 46 pips going from left to right.
The grey rectangle also shows how easy it is to identify consolidation zones.
Entering on the first bar that closed below the zone and exiting on the first bar that closed above a trailing EMA or trend line would have yielded another 300 pips over the next couple of weeks.
Compare that to the four hour candlestick time based chart for the same period of time. I’ve highlighted the same areas on this chart for comparison. Not only were the chart patterns much clearer on the range bar chart, the entries also came much earlier because you didn’t have to wait for the four hour period to complete before seeing the pattern.
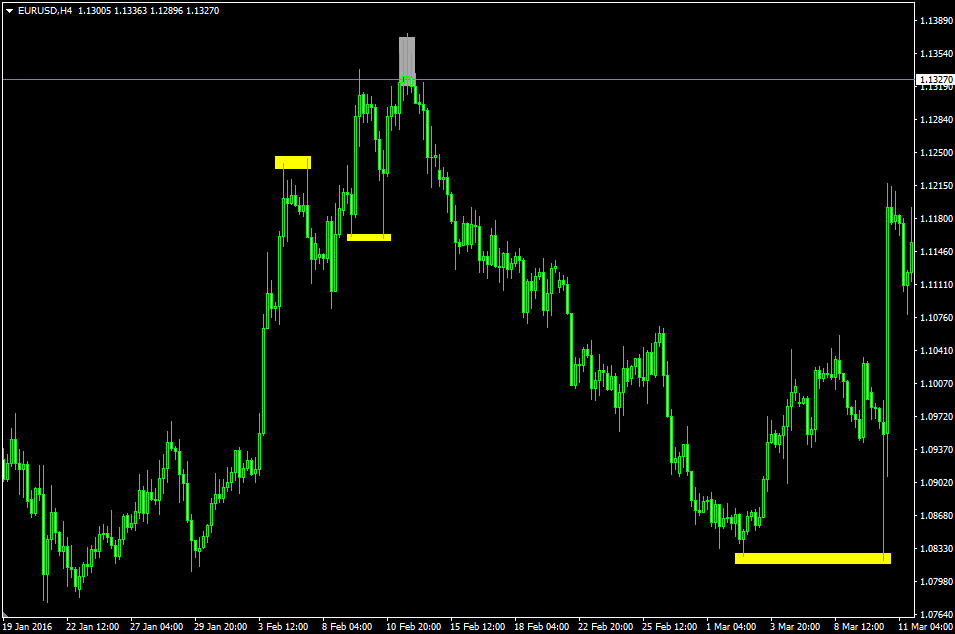
FOUR HOUR CANDLESTICK CHART
Even just looking at the chart for a quick scan for available trading opportunities or pending setups is a lot easier – especially on the eyes.
The less price that plots on the chart, the less chance you have of “searching” for a price pattern to trade. Humans are built pattern recognition machines so having less data can add to the probability that you have found a price pattern that truly exists.
I haven’t added any indicators to these charts but all indicators work exactly the same on range bars as they do on time based charts.
They actually work better!
Any of the strategies that we describe in our home page can be applied to range bars with greater success.
Most of the major charting platforms have range bars as one of the chart types available. For MT4 you’ll need an EA that creates range charts for you.
Here is a range bar indicator for MT4 that you can download.
Create a range bar chart and revisit your favorite swing trading strategies. You’ll be surprised at how much cleaner and clearer your charts and setups will be.
I’ll summarize the major benefits of trading with range bars:
We’re always looking for ways to improve our trading results and that sometimes means changing the way we look at our markets. Make the break from time based charts and give range bars a try.